In this guide
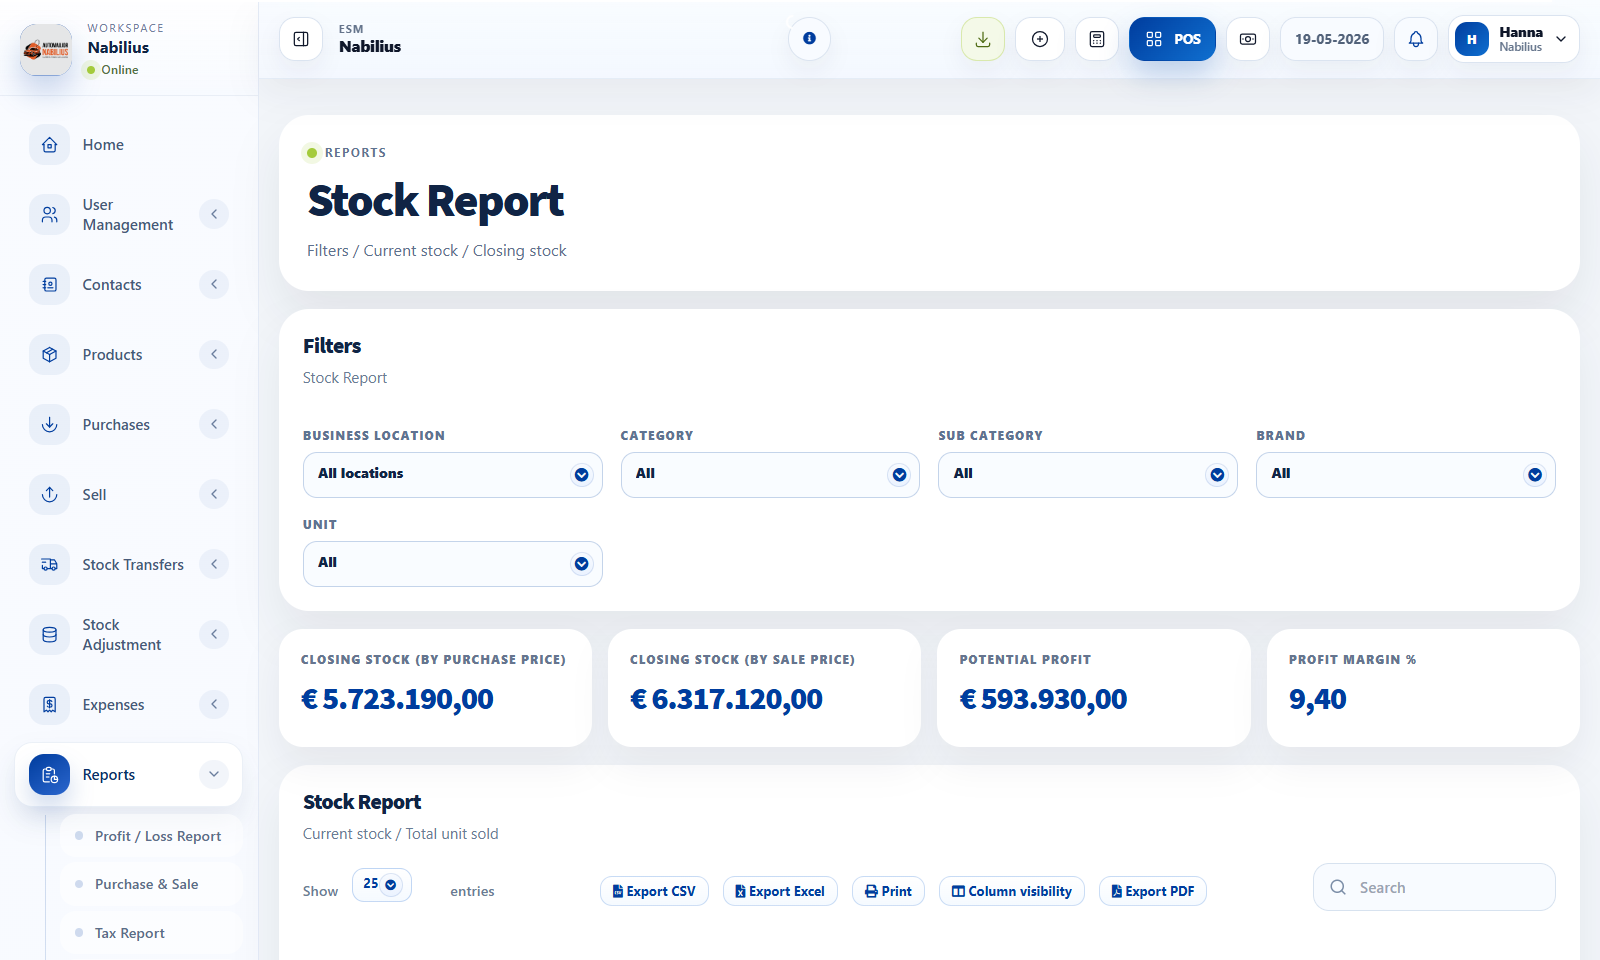
Stock report columns
Stock Report combines product setup, purchase cost, sale price, and movement totals.
- Current stock shows available quantity by selected filters.
- Current stock value by purchase price estimates inventory cost value.
- Potential profit compares purchase value and selling value.
- Transferred and adjusted totals show non-sale stock movement.
Stock history
Stock history explains why stock changed.
- Open product stock history from the table when quantity looks wrong.
- Review purchases, sales, returns, transfers, and adjustments in order.
- Use SKU, location, date, and reference numbers to track the source.
Fixing mismatches
Do not patch totals directly. Fix the source transaction or create an adjustment.
- Check if stock belongs to another location.
- Check if product is marked Not for selling or not stock-managed.
- Use Stock Adjustment only after confirming the physical count.
Detailed operating workflow
Use stock reports to audit current quantity, stock value, transfers, adjustments, and product history.
- Filter by location, category, brand, unit, and active status before reading quantities.
- Use Product Stock History for item-level movement over time.
- Review total rows in the same column structure as the table.
- Use stock value by purchase and selling price carefully because they answer different questions.
Check before moving on
Total row values align with current stock, stock value, sold units, transferred units, and adjusted units.
Scrollbar style and table padding match other modern tables.
Product stock history buttons have enough width for their labels.
Review signals and troubleshooting
Use these checks when the screen looks correct but the numbers, records, or workflow do not behave as expected.
- If stock is negative or zero unexpectedly, inspect purchase, sale, return, adjustment, and transfer history.
- If stock value is wrong, check purchase price and tax settings.
- If a product is missing, confirm active status and location availability.