In this guide
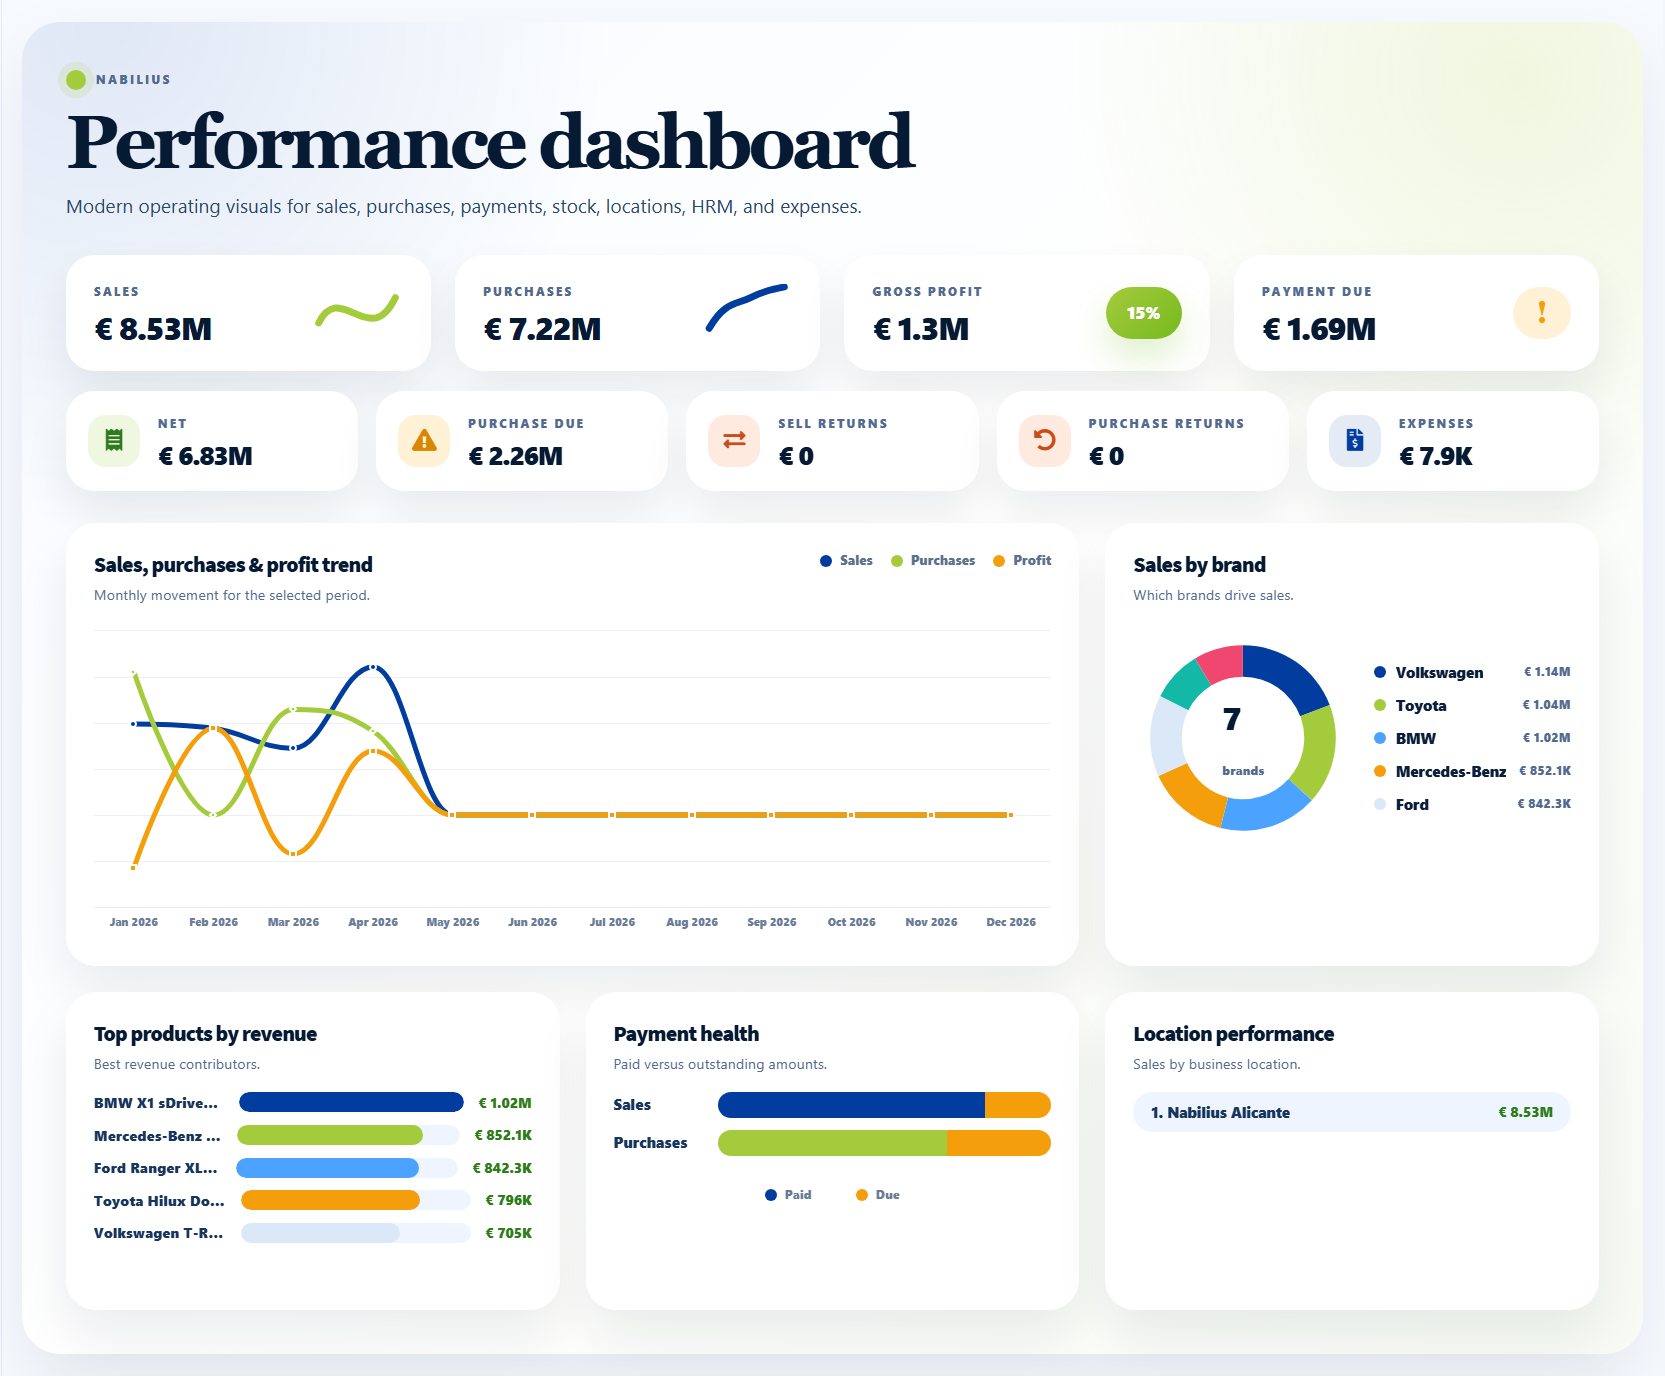
What the dashboard shows
The dashboard gives a fast operational summary for the selected date range and location.
- Sales and purchase totals show transaction movement for the selected date range.
- Stock alerts highlight products that need attention.
- Payment due widgets help track customer and supplier balances.
- Date filters should be used before comparing dashboard numbers with reports.
Filtering the dashboard
Always confirm the date range before judging performance.
- Use Filter by date to switch between today, yesterday, this month, custom ranges, and annual views.
- Use location filters when the business has more than one branch or warehouse.
- Reload only when necessary; most filters update the visible metrics directly.
Common review routine
For daily operations, review the dashboard at opening, mid-day, and closing.
- Check stock alerts before sales begin.
- Review sales payment due before closing the cash register.
- Check recent transactions and activity logs when numbers look unexpected.
Detailed operating workflow
Use the dashboard as the daily control room for sales, purchases, stock, payments, and recent activity.
- Start by selecting the current financial year or the exact operating date range you want to review.
- Review KPI cards first, then move to charts, stock alerts, payment due tables, and recent transactions.
- Use location filters before comparing branches, warehouses, registers, or staff performance.
- Open the underlying report when a dashboard number needs accounting-level detail.
Check before moving on
Dashboard and report filters use the same date range.
Location totals are not mixed with all-location totals.
Unpaid or partial transactions are considered before judging performance.
Review signals and troubleshooting
Use these checks when the screen looks correct but the numbers, records, or workflow do not behave as expected.
- Investigate sudden sales changes with Sales Report and Activity Log.
- Investigate low stock with Stock Report, Product Stock History, and purchase status.
- Investigate payment due with Sell Payment Report, Purchase Payment Report, and contact ledgers.
Practical notes
- Dashboard numbers are only as reliable as the date range, location filter, and completed transaction status.